


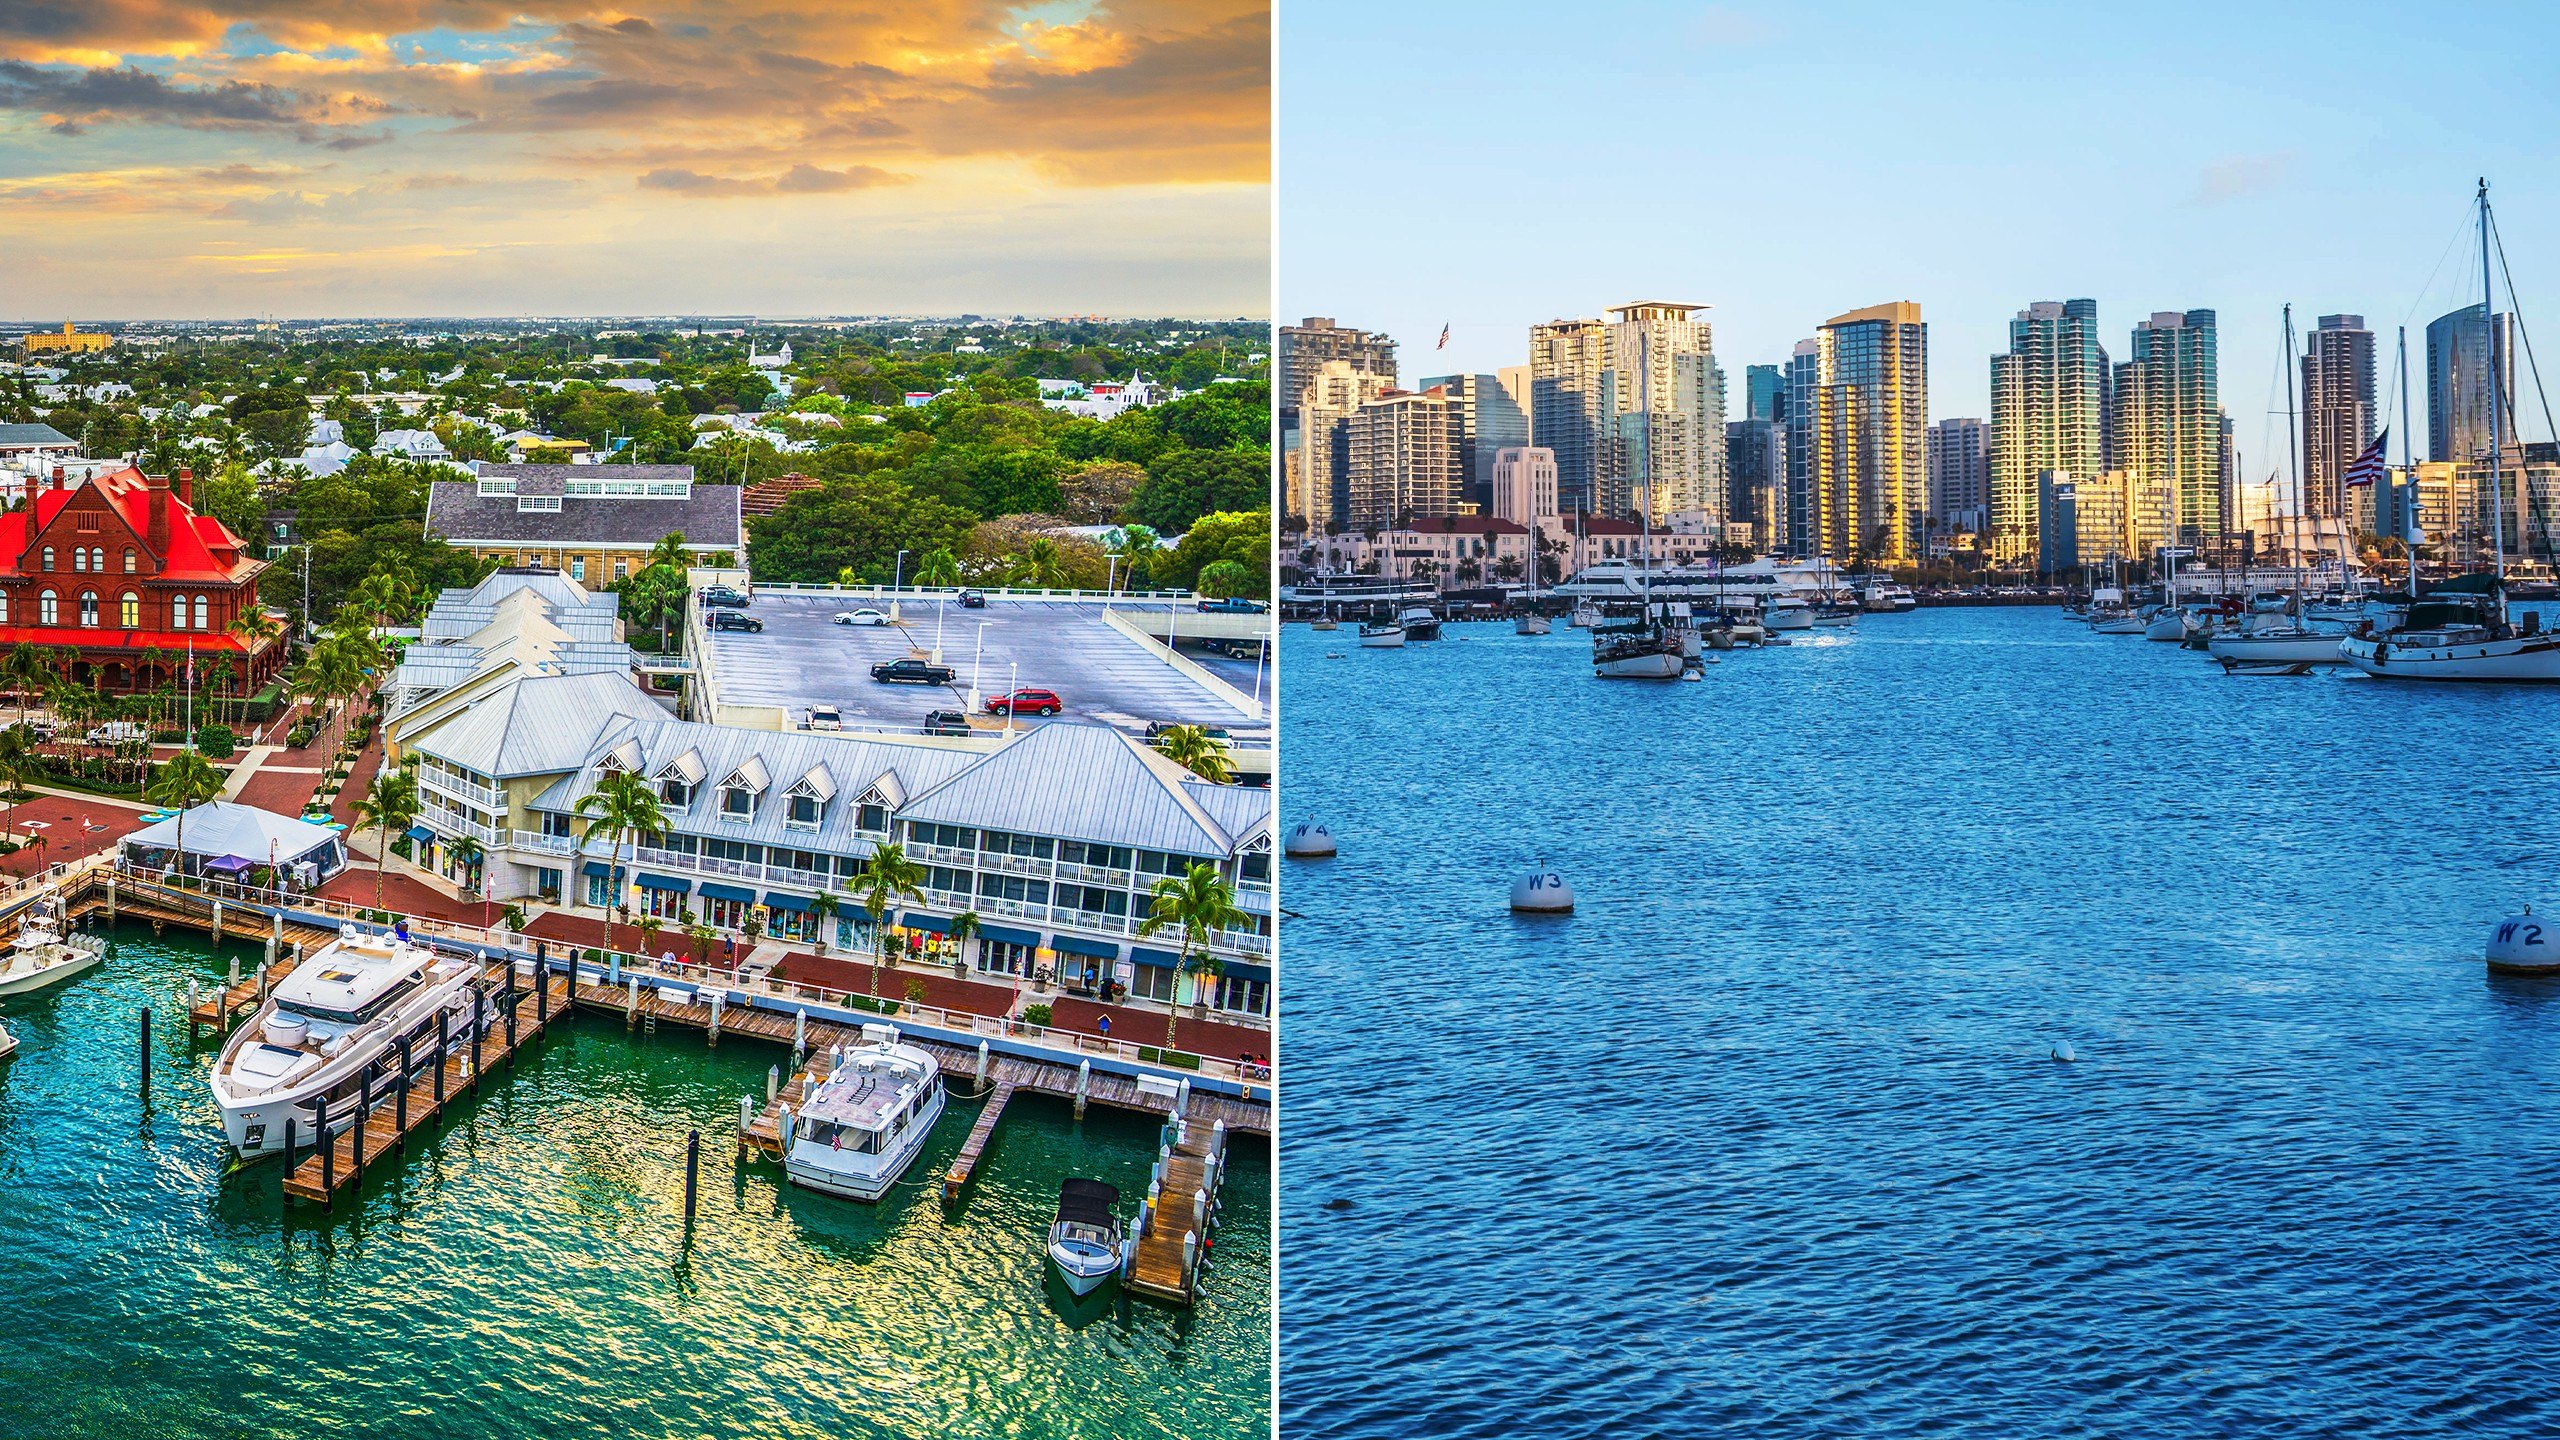
Coast vs. Key: Two warm-weather markets on opposite ends of the size scale
Year-round sun, coastal access, and mild winters usually come at a premium, and that is exactly what shows up in the San Diego and Key West markets. Beyond the warm climate and sought-after beaches, both carry deep Native American histories, and both saw Spanish contact in the 1500s. Over the years, each has drawn buyers willing to pay for permanent access to the water, and today both sit well above the national luxury threshold.
Headline trends
- A decade ago, San Diego led, but now Key West luxury is pricier. The top 10% threshold in the Key West Micropolitan area stands at $4,525,000, roughly 262% above the national luxury benchmark of $1,250,459. San Diego’s entry point sits at $2,768,201, about 121% above the national level.
- The gap widens at every tier above. At the 95th percentile, Key West’s $7,119,000 runs 1.6 times San Diego’s $4,404,476. At the 99th percentile, Key West reaches $23,572,583 against San Diego’s $9,999,055, a multiple of 2.4. Both markets clear the national ultraluxury benchmark of $5,429,402, but Key West does so by more than four times.
- More than half of Key West’s inventory is already a million-dollar listing. Million-dollar homes make up 55.9% of active inventory in the Key West Micropolitan area and 42.9% in San Diego, both far above the national share of 13.2%. Depth runs the other way: San Diego carries 2,492 active million-dollar listings against Key West’s 714, reflecting a market roughly 3.5 times larger by inventory.
- Each market draws most heavily from the largest metro in its own state. Los Angeles is roughly 120 miles northwest and accounts for 29.3% of San Diego’s cross-market listing views. Miami is adjacent to the Key West Micropolian area and accounts for 29.9% of market demand.
| Area | Million-Dollar Listing Count | Share of Million-Dollar Listings |
| USA | 148,525 | 13.2% |
| San Diego-Chula Vista-Carlsbad, CA | 2,492 | 42.9% |
| Key West-Key Largo, FL | 714 | 55.9% |
Trading Places
A decade ago, San Diego had the higher bar for entry into the luxury tier, (top 10%). In July 2016, that threshold sat at roughly $2.34 million in the San Diego metro compared to $1.85 million in the Key West micropolitan area, a gap of about $496,000, or 27%. Today the positions have flipped. Key West’s luxury entry point stands at $4.53 million against $2.77 million in San Diego, putting Key West about $1.76 million, or 64%, ahead.
The reversal is not a recent development. Key West first passed San Diego in late 2017 and has held the higher luxury entry point in every month since January 2018. That gap widened after the pandemic. The spread between the two stood at about $324,000 in July 2018, reached $1.13 million by July 2021, and sits at its widest point of the decade today.
San Diego’s luxury threshold rose 18.2% over the 10 years, short of the 57% gain in the national 90th percentile listing price. Key West’s climbed 145%, roughly 2.5 times the national pace. Measured from February 2020, the divide is apparent, San Diego is up 2.7% while the nation is up 34.3% and Key West is up 53.4%.
Both markets ran up during the pandemic, but their paths since have differed in depth and timing. The San Diego metro peaked in July 2023 at $3.9 million and has since given back 28.9%, landing near the $2.73 million to $2.79 million range last seen in the summers of 2020 and 2021. The Key West micropolitan area saw a more shallow decline after the pandemic and rebounded to levels hovering near $5 million. Prices there peaked in January 2026 at $5.3 million and have since declined 14.5%. Its entry point has held between roughly $4.44 million and $5.3 million since the start of 2024. Although Key West’s smaller size means somewhat more volatile pricing trends than in San Diego, that $4.44 million low still sits above every monthly reading the San Diego metro has posted in the past decade.
Luxury tiers at a glance
| Area | Median Listing Price | Top 10% (Entry Luxury) | Top 5% (High-End Luxury) | Top 1% (Ultraluxury) |
| USA | $428,950 | $1,250,459 | $1,974,349 | $5,429,402 |
| San Diego | $922,500 | $2,768,201 | $4,404,476 | $9,999,055 |
| Key West | $1,195,000 | $4,525,000 | $7,119,000 | $23,572,583 |
The gap widens further up the price ladder. Key West’s 95th percentile listing price of $7.12 million runs 1.6 times San Diego’s $4.40 million, and at the 99th percentile the $23.57 million in Key West is 2.4 times San Diego’s $10.0 million. Another significant difference between the two markets is size. San Diego is a much larger market, with a population just over 3.3 million, while Key West comes in at nearly 82,000. Key West also carries far more homes for sale per person, at 15.6 active listings per 1,000 residents against 1.8 in San Diego and 3.4 nationally. Roughly 27% of homes in the Key West micropolitan area are vacation homes, more than 8 times the national share of 3.3%. Those owners are counted as residents elsewhere, so listings are being measured against a resident base that never included them.
Scale vs. Scarcity
Market size shapes these thresholds. Since the entry point to luxury is a percentile, the more inventory a market carries, the further that cutoff reaches down into moderately priced stock. San Diego’s 5,800 active listings put roughly 580 homes above its 90th percentile. Key West’s 1,280 listings put only about 130 above its threshold. Large metros hold a deep base of moderately priced inventory that pulls the line lower. Key West has almost none. More than half of its active listings, 55.9%, are already above $1 million, compared to 42.9% in San Diego and 13.2% nationally.
Running out of room
The smaller population in Key West does not make it a less desirable market, however, the supply side works differently. The Florida Keys sit within an Area of Critical State Concern, and new residential construction is rationed through a state controlled permit allocation system tied to maintaining a 24-hour hurricane evacuation time. The City of Key West has nearly run out of building capacity. As of mid-2026, its remaining residential allocation stood at 0.84 units, meaning the city could not permit an additional single-family home without new capacity from the state. Florida’s 2026 expansion of the Live Local framework requires local governments to approve qualifying multifamily and mixed-use residential development in commercial and industrial zones, but it excludes areas of critical state concern,so the state’s allocation cap continues to govern the market rather than the new mandate.
San Diego’s market in comparison has lagged, but on the demand side. Price growth in the metro did not keep pace with the national level, and San Diego was one of the markets that gave back the most pandemic gains in the country. The city of San Diego permitted 8,782 new homes in 2024, part of a two-year run averaging roughly 9,200 a year and more than 31,000 permitted since 2021, about 40% above its early-2020s pace. Key West is running out of zoned capacity under a fixed state allocation, while San Diego’s is growing.
Where demand comes from
Both markets pull most heavily from the largest metro in their own state. The latest cross-market data show that 29.3% of San Diego’s cross-market views came from the Los Angeles metro, with the next two sources dropping off sharply: Riverside at 9.7% and San Jose at 8.3%. Key West follows a similar shape, with 29.9% of its cross-market views coming from the Miami metro before a steep falloff to New York at 5.3% and Washington, DC at 3.3%.
Standout Areas
San Diego metro wins the ZIP comparison outright. All five of its standout areas post higher median prices than any ZIP code in the Key West micropolitan. However, the San Diego metro has 99 ZIP codes, while the Key West micropolitan area has 9, so those five sit at the very top of a much wider range.

La Jolla California Aerial – stock photo The community of La Jolla in the city of San Diego.
San Diego ZIPs
| ZIP | Area | Listings | Median price | $/sq ft | Median sq ft | Share $1M+ |
| 92067 | Rancho Santa Fe | 90 | $6,889,750 | $1,033 | 6,905 | 100% |
| 92014 | Del Mar | 53 | $4,408,125 | $1,422 | 2,710 | 83.8% |
| 92118 | Coronado | 123 | $3,047,500 | $1,721 | 1,716 | 98% |
| 92037 | La Jolla | 171 | $2,935,000 | $1,227 | 2,234 | 78.9% |
| 92075 | Solana Beach | 46 | $2,375,000 | $1,252 | 1,768 | 90.1% |
Rancho Santa Fe (92067) sits at the top of the San Diego luxury market at $6.89 million, and it is the only ZIP code in either market where every active listing is priced above $1 million. Its defining feature is scale with a median of 6,905 square feet, more than double any other ZIP code in the top five. That footprint is also why its price per square foot of $1,033 is the lowest of the group. Rancho Santa Fe is a land and acreage market in an expensive metro.
Coronado (92118) is the inverse. Coronado’s $1,721 per square foot is the highest in either market, roughly 67% above Rancho Santa Fe. Nearly all of its inventory, 98%, clears $1 million. Coronado is an island connected by a single bridge with a substantial Navy footprint, and the pricing and size of homes in this ZIP reflect that constraint.
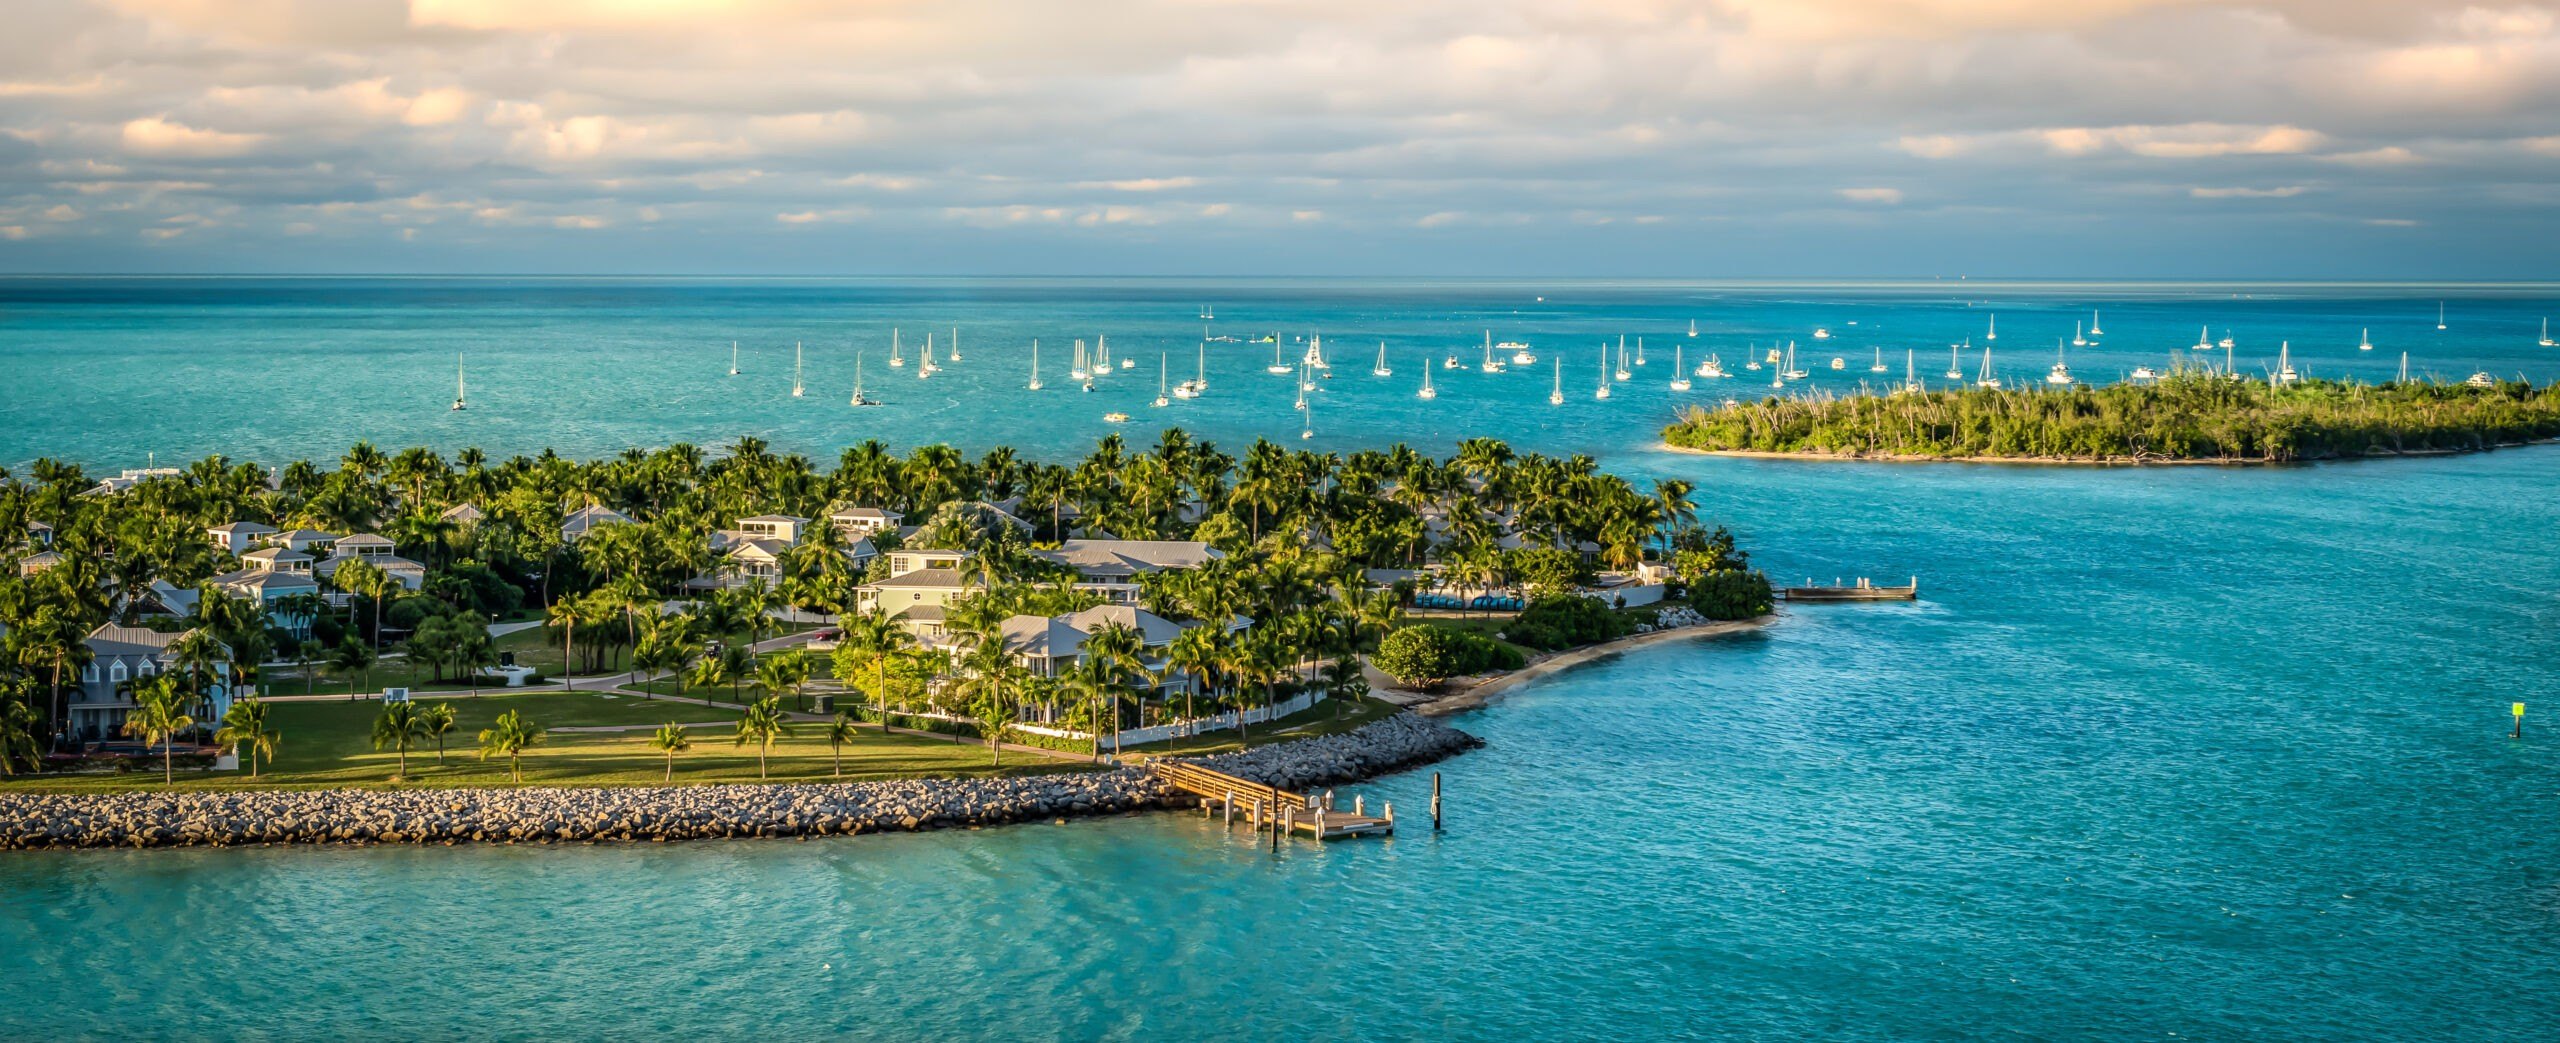
Key West, Florida
Key West ZIPs
| ZIP | Area | Listings | Median price | $/sq ft | Median sq ft | Share $1M+ |
| 33036 | Islamorada | 109 | $2,667,500 | $1,163 | 1,988 | 71.1% |
| 33042 | Summerland Key | 109 | $1,299,250 | $888 | 1,570 | 67.9% |
| 33040 | Key West | 302 | $1,211,000 | $946 | 1,382 | 58.5% |
| 33037 | Key Largo | 256 | $1,200,000 | $706 | 1,632 | 53.% |
| 33050 | Marathon | 254 | $1,097,000 | $771 | 1,443 | 51.7% |
Islamorada (33036) leads the Key West Micropolitan area at $2.67 million and its price per square foot of $1,163 is significantly higher than the other standout ZIP codes in the area, which is notable because it also has the largest median homes in the region. It is a concentrated luxury ZIP, with the largest share of million-dollar listings within the market.
Key West proper (33040) is the inventory center of the market, accounting for roughly 24% of all active listings across the nine ZIP codes. Its $946 per square foot on a median 1,382 square feet reflects the historic district’s small lots and older housing stock. Key Largo (33037) has the lowest price per square foot out of the standout ZIPs. As the northernmost key and the closest to Miami, it functions as the entry point to the market in both geography and price per foot.
The takeaway
San Diego and Key West both sell access to a warm coastline, but they have arrived at very different places in doing it.
Key West is the more expensive but much smaller market, with a luxury entry point of $4.53 million that runs 64% above San Diego’s $2.77 million and widens further up the ladder to 1.6 times at the 95th percentile and 2.4 times at the 99th. The Key West Micropolitan area pricing rests on inventory with hard limits.
San Diego is the larger and deeper market. It offers 5,800 active listings against Key West’s 1,280, with enclaves that span estate acreage inland to island scarcity in Coronado at $1,721 per square foot. However, its luxury tier rose just 18.2% over the decade against 57% nationally, and only 2.7% since February 2020. San Diego did not lose ground because it ran out of room. It lost ground because demand at the top thinned out, and it now sits 28.9% below its July 2023 peak, back near where it stood in the summers of 2020 and 2021. One market has scale and the other has hard limits.
Methodology
All data in this report is sourced from Realtor.com® listing trends as of July 2026, reflecting active inventory of existing homes, including single-family residences, condos, townhomes, row homes, and co-ops. Listings reflect only those posted on MLS platforms that provide listing feeds to Realtor.com. New-construction listings are excluded unless actively listed on participating MLSs.
Luxury segmentation is based on market-specific price percentiles, with the 90th percentile representing entry-level luxury, the 95th percentile marking high-end luxury, and the 99th percentile indicating ultraluxury. All calculations are based on listing prices, not final sales prices. For more on luxury methodology, see realtor.com/research/what-is-luxury/
Metropolitan and micropolitan areas are defined using the Office of Management and Budget’s OMB-2023 delineations, with Claritas 2025 household estimates used for relative comparisons. Where appropriate, we limited the analysis to metros or micros with a minimum average number of active million-dollar listings over the past year to ensure meaningful comparisons.
Historical listing trend data extends to July 2016, but year-over-year comparisons in this report use July 2025 as the baseline.
Luxury by the Numbers
90th percentile = Entry-level luxury (top 10% of prices)
95th percentile = High-end luxury
99th percentile = Ultraluxury (often rare or custom properties)


